- Updated
SWOT analysis graphic
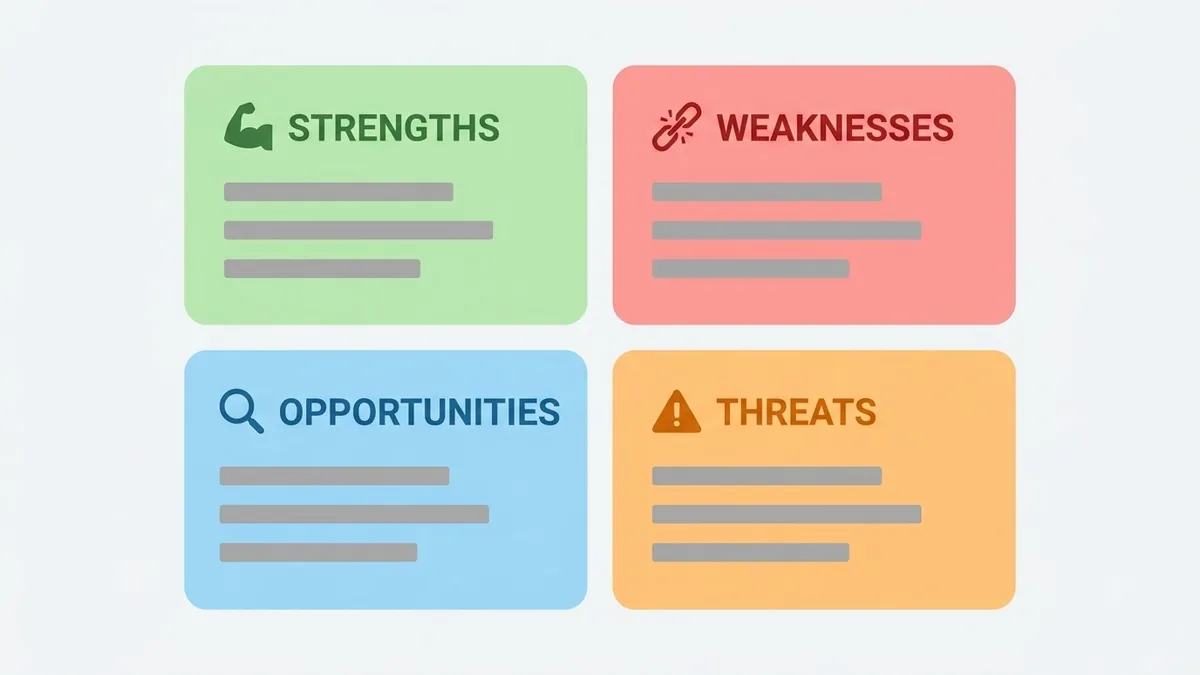
This prompt makes a presentation-ready SWOT grid with four colour-coded quadrants labelled Strengths, Weaknesses, Opportunities and Threats, each with a small icon and three placeholder bullet points.
SWOT analysis graphic for a presentation: a 2x2 grid with four colour-coded quadrants labelled Strengths, Weaknesses, Opportunities and Threats, each with a small icon and three placeholder bullet lines, [COLOURS] palette, clean modern business style. --ar 16:9
Write your real points in a text list and add them to the graphic in an editor.
Get a better result
A 16:9 slide with a 2x2 grid of four colour-coded quadrants labelled Strengths, Weaknesses, Opportunities and Threats, each with a small icon and three placeholder bullet lines, in your colour palette.
SWOT has a fixed layout of four quadrants, so the prompt asks for colour-coded boxes with icons and placeholder lines. The placeholders are on purpose, because your real points go in later in an editor, as the tip says.
The AI fills the quadrants with made-up points.
Fix: Follow the tip. Treat the bullets as placeholders and type your real points into the graphic in an editor.
- The quadrant labels are in the wrong order. Say “top left Strengths, top right Weaknesses, bottom left Opportunities, bottom right Threats”.
- The colours clash or carry no meaning. Name them: “green for strengths, orange for weaknesses, blue for opportunities, red for threats”.
Change the title to “Personal SWOT” and the icons to “a small person, a book, a door and a storm cloud”. Fill in your own points in an editor before sharing.
Make it a tall 4:5 picture and keep everything else exactly the same.
Guides that use this prompt
More image generation prompts
See all 347 →
More like this
- Run a SWOT analysis for a business or ideaChatGPT · Gemini · Claude
- Skills gap analysis for a target roleChatGPT · Gemini · Claude
- T-shirt graphic for printIdeogram · Midjourney · ChatGPT
- Valentine's Day promotion graphicGemini · ChatGPT · Midjourney
- Two-column comparison graphicGemini · ChatGPT · Midjourney