AI infographic prompts: how to actually get readable text
Published
Short answerKeep every label under six words, give the AI the exact text in quotes, and pick a diagram shape, timeline, process flow, numbered list, instead of asking for "an infographic about X". Shorter text renders far more accurately.
Text inside AI-generated images used to be a lost cause: close your eyes and guess, because the letters would come out as a rough approximation of writing rather than actual words. That's changed a lot, and it's worth knowing why, because it changes how you should write the prompt.
Google's newer image model, marketed as Nano Banana Pro and built on Gemini 3 Pro, pushed this further than most. BGR reported that AI-made infographics went viral after its release, and Interesting Engineering covered the model's jump in output clarity, describing it as producing clearer text and more accurate visuals than earlier image models. You don't need that specific model to use the prompts below, Gemini and ChatGPT's current image tools handle short, well-structured text reasonably well, but it's worth trying your prompt on more than one tool if the first result garbles a word.
Keep every label short
This is the single rule that matters most. Short words render correctly far more often than long ones, and a long sentence practically guarantees at least one mangled letter somewhere in it. Before you generate anything, go back through your points and cut each one down to a handful of words.
| Too long | Short enough |
|---|---|
| "Make sure you track every single expense you make" | "Track every expense" |
| "Remember to automate your savings each month" | "Automate savings" |
| "Q1: Initial product research and customer discovery" | "Q1: Research & discovery" |
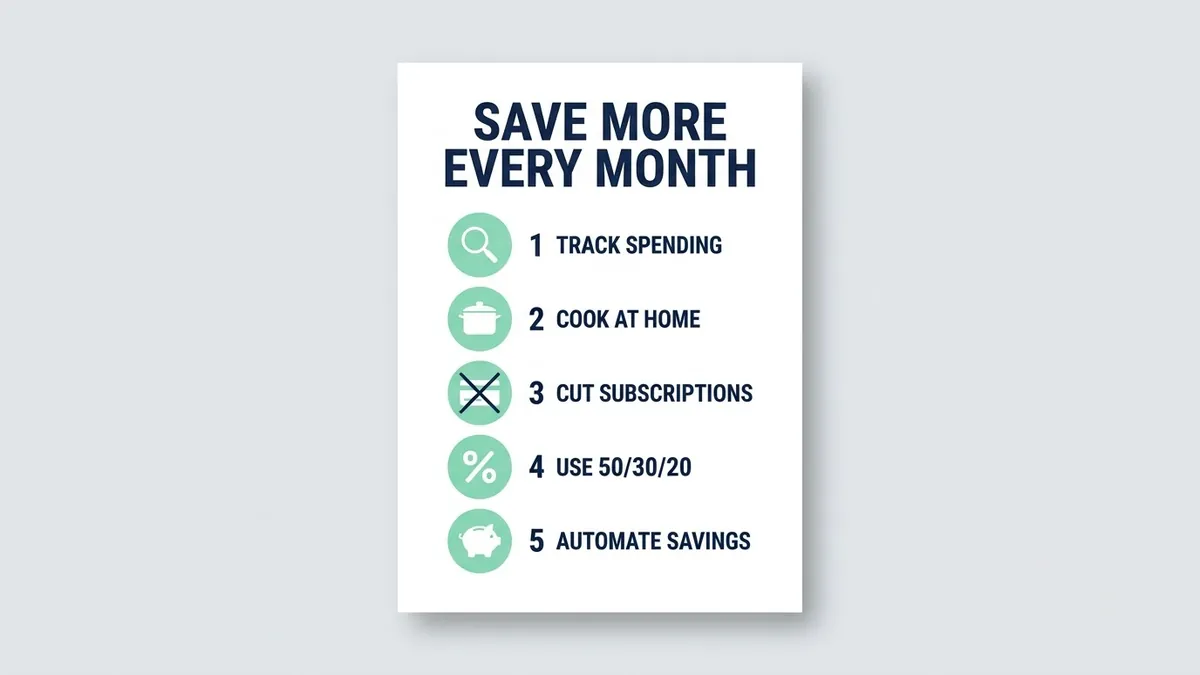
Create a clean, modern infographic titled "[TITLE, e.g. 5 Ways to Save Money Every Month]".

Show these points as numbered sections, each with a simple flat icon:
[POINTS, e.g. 1. Track every expense 2. Cook at home 3. Cancel unused subscriptions 4. Use the 50/30/20 rule 5. Automate savings]

Style: flat vector design, a [COLOURS, e.g. navy and mint green] palette, lots of white space, and large readable sans-serif text spelled exactly as written.
The clean infographic prompt puts the title in quotes and keeps each point to a handful of words. Both of those choices exist specifically to protect the text. Quotes tell the model exactly what to spell; short points give it less room to get a word wrong.
Name the shape of the diagram
"An infographic about X" leaves the layout entirely up to the model, which usually means a generic poster rather than something that actually explains a sequence or a comparison. Decide what shape the information needs, a timeline, a flow, a grid, and ask for that shape directly.
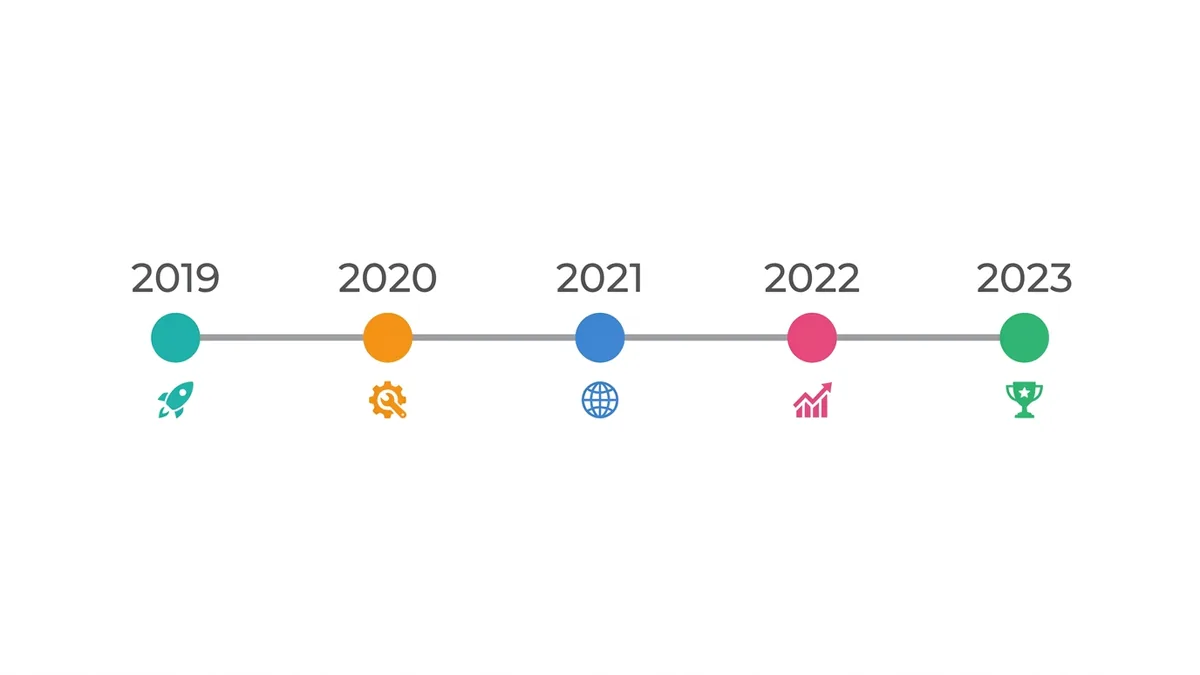
Clean horizontal timeline infographic titled "[TITLE]" with [NUMBER] milestones: [MILESTONES WITH DATES]. Each milestone has a numbered circle, a small icon, a short label and a date, connected by a smooth line, [COLOUR] palette on white, modern flat design with plenty of space.
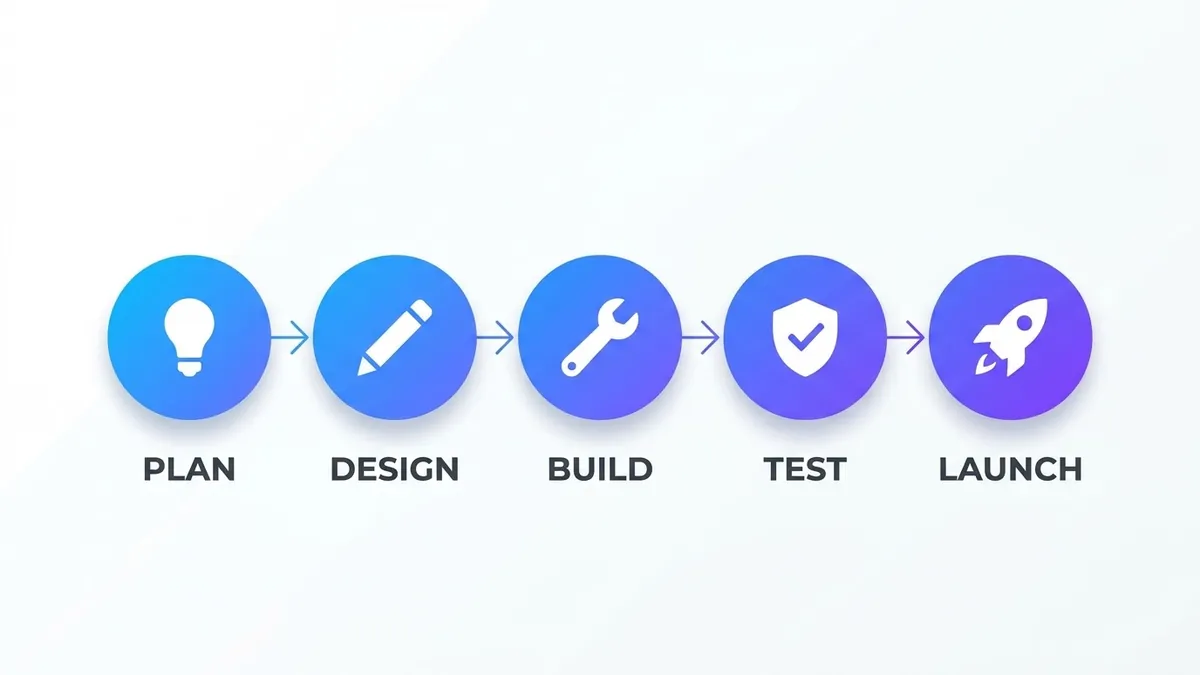
The infographic timeline prompt names the exact elements a timeline needs: a numbered circle, a short label, a date, a connecting line. For a sequence of steps rather than dated events, the process flow infographic prompt uses the same approach with arrows between numbered steps instead of a line between dates. In both cases, limiting the count (five milestones, five steps) keeps every individual label big enough to render clearly.
Business diagrams follow the same rule
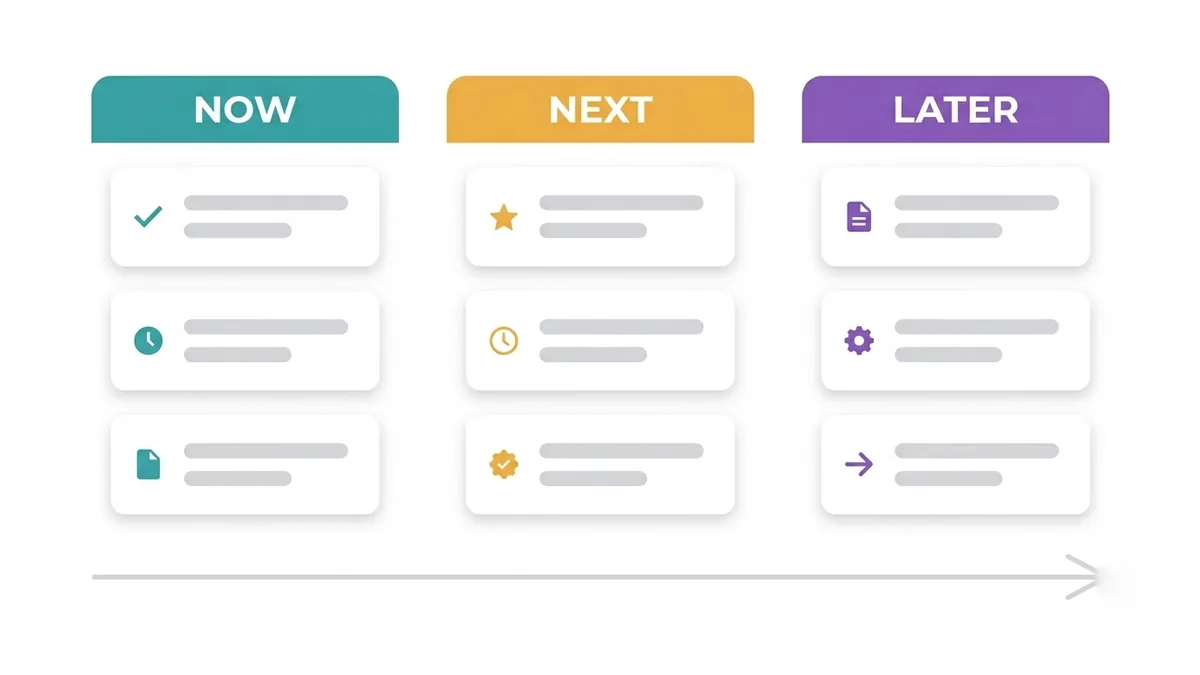
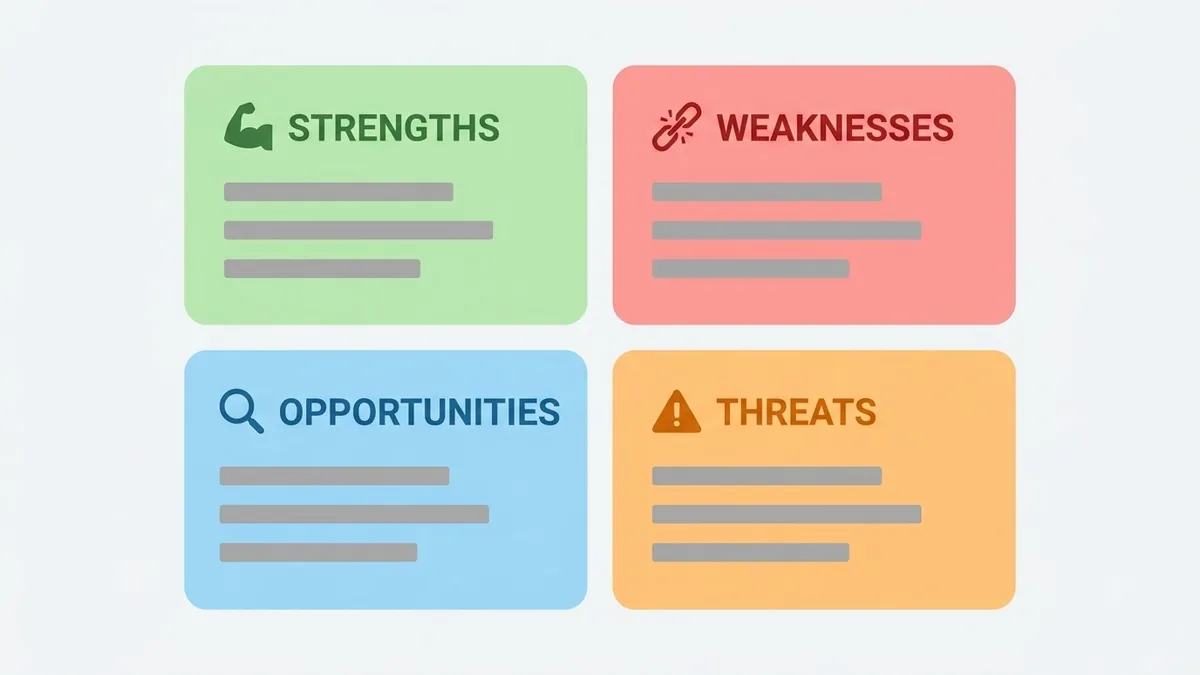
A roadmap or a SWOT grid is really the same problem as an infographic: short labels in a named layout, not a paragraph of text the model has to lay out itself.
SWOT analysis graphic for a presentation: a 2x2 grid with four colour-coded quadrants labelled Strengths, Weaknesses, Opportunities and Threats, each with a small icon and three placeholder bullet lines, [COLOURS] palette, clean modern business style.
The SWOT graphic prompt and the product roadmap graphic prompt both ask for placeholder bullet lines rather than your real business content inside the prompt. Generate the layout first, then type your actual points into the image afterwards in an editor, where every character is correct by definition. That split, AI for the layout, you for the exact words, is the most reliable fix there is for text that matters.
When a word still comes out wrong
Even with short labels in quotes, one word will occasionally come out wrong, especially a brand name, a number, or anything with unusual spelling. Don't regenerate the whole infographic for one bad word. Either:
- Ask the tool to fix just that one label, naming it directly: "the third label should read '[EXACT TEXT]', fix only that word."
- Or add the correct text afterwards in any basic photo editor or Canva, which takes seconds and is completely reliable.
For anything going out publicly, a report cover, a social post with a stat on it, check every word before you publish. A single AI-generated infographic can look entirely correct at a glance and still have one wrong digit in a number nobody double-checked.
Where to go from here
If the infographic needs to live inside a bigger moodboard or pitch, see Adobe Firefly Boards prompts for laying out a full set of visuals together. Browse more diagram and layout ideas in marketing prompts, or use the prompt builder to turn your own points into a ready-to-fill prompt.
Quick checklist
- Keep every label under six words; cut sentences down before you generate.
- Put the exact title and any real text in quotation marks.
- Name the diagram shape (timeline, flow, grid) instead of just the topic.
- Limit the count: five milestones or five steps keeps each label legible.
- Fix one wrong word by hand rather than regenerating the whole image.

Comments
No comments yet. Be the first to share what worked for you.