- Updated
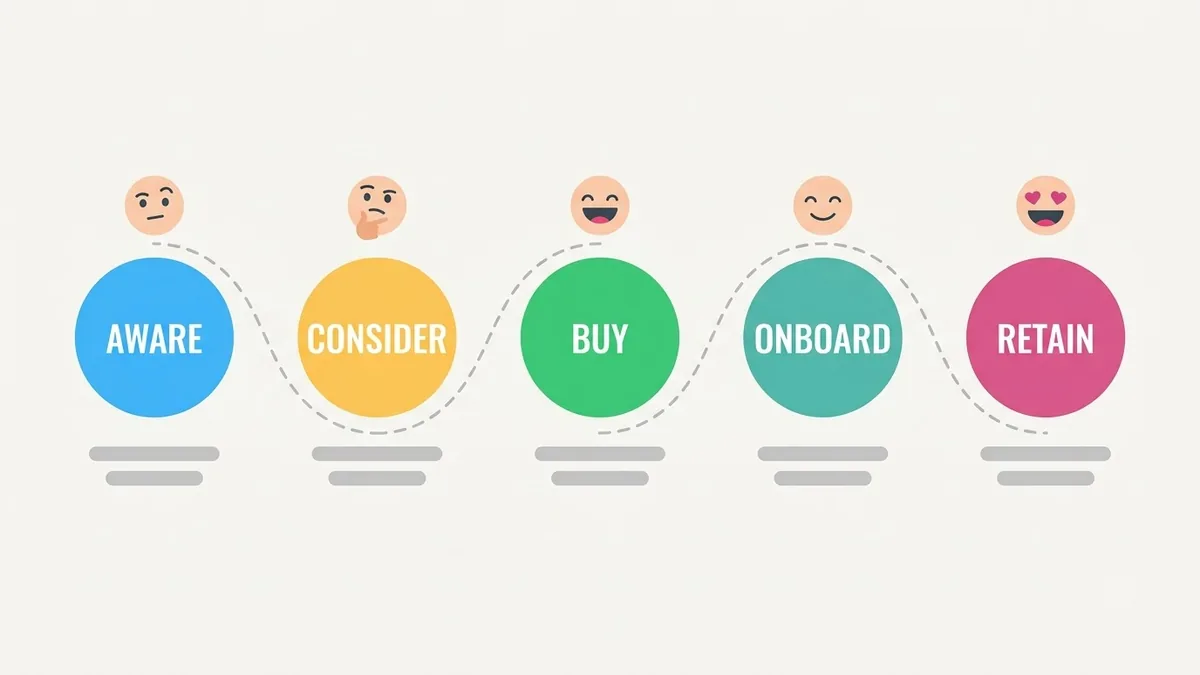
Customer journey map graphic
This prompt makes a journey map with stages Awareness, Consideration, Purchase, Onboarding and Loyalty along the top and rows for actions, thoughts and emotions with a smooth emotion curve.
Customer journey map graphic with stages Awareness, Consideration, Purchase, Onboarding and Loyalty along the top, rows for actions, thoughts and emotions with a smooth line showing satisfaction rising and falling, small icons, [COLOUR] palette on white, clean UX presentation style. --ar 16:9
Use it as a layout, then fill in your real stages and emotions.
Get a better result
A 16:9 journey map with five stages along the top, rows for actions, thoughts and emotions, a smooth satisfaction line that rises and falls, small icons and a clean presentation style.
Journey maps share a standard layout: stages across the top, rows for actions, thoughts and emotions, and a line showing how satisfaction rises and falls. The prompt asks for that structure so the graphic is a usable template. Small icons and one colour keep it clean for a slide.
The text is nonsense.
Fix: Use it as a layout, as the tip says, and fill in your real stages, quotes and emotions yourself.
- The emotion line is arbitrary. Base it on real customer feedback or survey data, not on the AI’s guess.
- The map is too busy. Ask for fewer icons and larger text in each cell.
Ask for a row of red pain-point markers under each stage and a final row for ideas to fix them.
Keep the layout. Put this data in the emotion row: [DATA], and mark the two biggest drops in satisfaction in red.
Guides that use this prompt
More image generation prompts
See all 347 →
More like this
- T-shirt graphic for printIdeogram · Midjourney · ChatGPT
- Map the arguments on both sides of an issueChatGPT · Gemini · Claude
- Train journey through countrysideVeo · Kling · Seedance
- Illustrated map of continents for kidsMidjourney · Gemini · ChatGPT
- Tech conference speaker on stageGemini · ChatGPT