- Updated
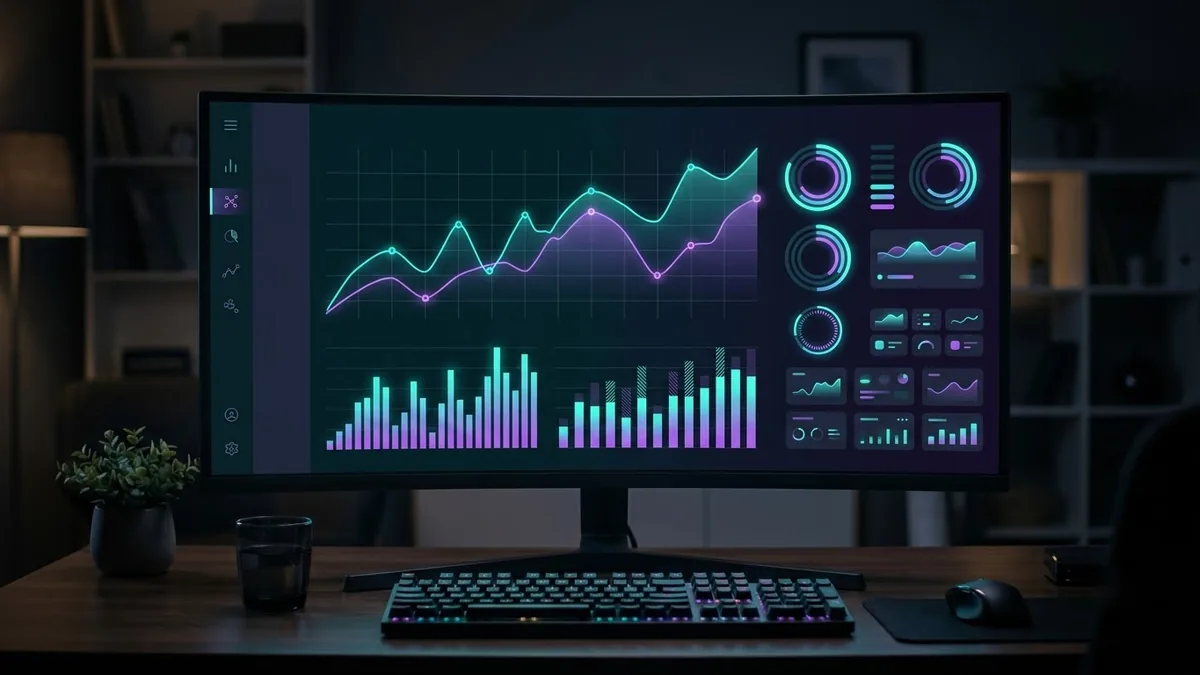
Dark mode analytics dashboard
This prompt creates a polished concept of a dark dashboard for a business type: a left sidebar, four KPI cards, a large line chart, a bar chart and a recent activity table on a navy background with neon accents.
Dark mode analytics dashboard UI for a [TYPE] business. A left sidebar with icons, top row of four KPI cards, a large line chart, a bar chart and a table of recent activity, deep navy background with [NEON COLOUR] accents, crisp modern typography, subtle glow, polished product-design look. --ar 16:9
Ask for one focused chart per card; crowded dashboards look cluttered when generated.
Get a better result
A polished dark dashboard mockup with a left sidebar, four KPI cards, a large line chart, a bar chart and an activity table on a deep navy background with neon accents.
Dashboards follow a familiar layout: a sidebar, a row of KPI cards, charts and a table. Naming each piece gives the model a plan. A navy background with one neon accent keeps it readable, and one chart per card, as the tip says, avoids clutter.
The screen looks cluttered.
Fix: Ask for one focused chart per card, as the tip says, and fewer rows in the table.
- The numbers and labels are fake and garbled. Treat it as a style reference. Rebuild the real screen in a design tool with real data.
- The accent colour overpowers everything. Use the neon colour only for key numbers and one line, with muted greys elsewhere.
Create the same dashboard in a clean light theme so you can compare the two and choose a default.
Keep the layout. Make a version with the sidebar collapsed to icons only and the KPI numbers twice as large.
More image generation prompts
See all 347 →

More like this
- Plan a spreadsheet dashboardChatGPT · Gemini · Claude
- Add a portrait-mode blur to the backgroundGemini · ChatGPT
- Emotions chart for kidsMidjourney · Gemini · ChatGPT
- Company org chart graphicGemini · ChatGPT · Midjourney
- Design an age-appropriate chore chartChatGPT · Gemini · Claude